
What is Visual Content Creation and How to Do It?

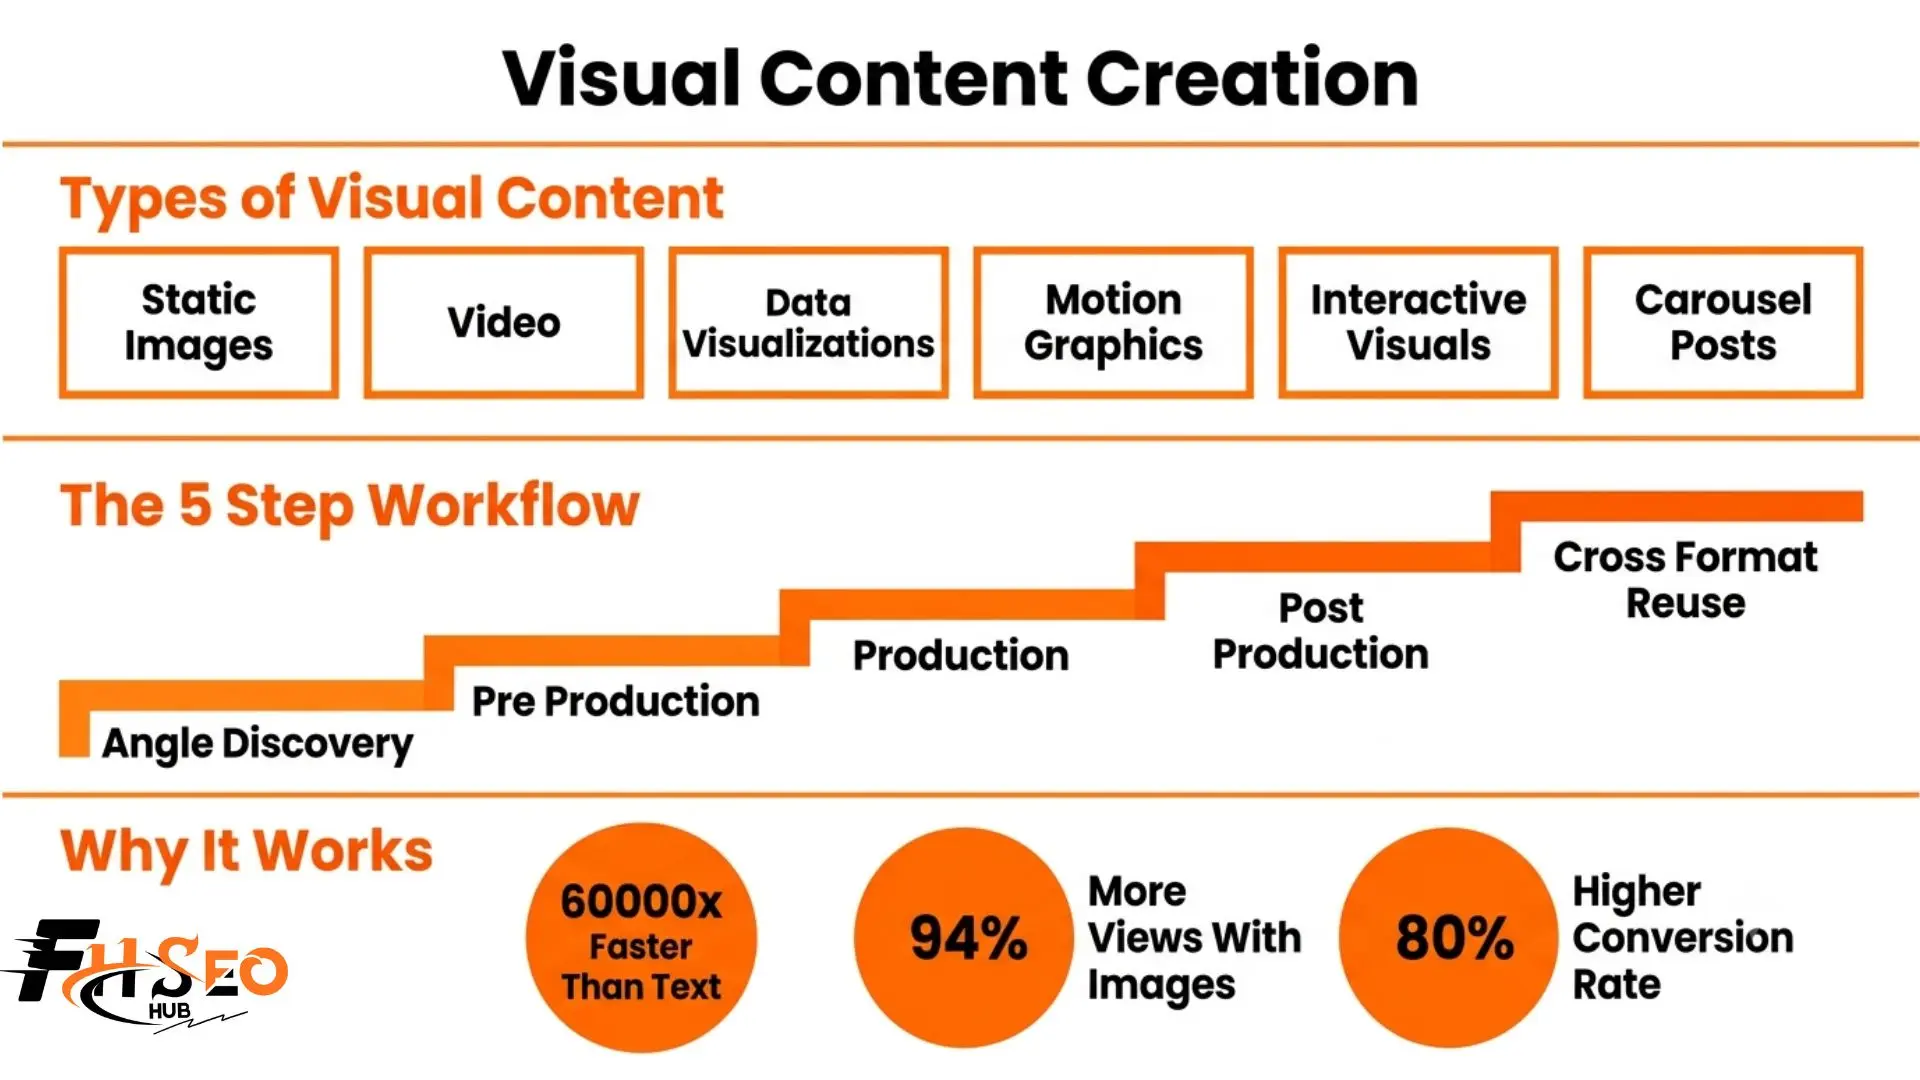
Visual content creation is the process of designing and producing images, videos, infographics, and other visual assets for marketing campaigns, social posts, and websites. It turns a written message into something a viewer understands in seconds. Most guides stop at repeating that the brain processes images 60,000 times faster than text. This one goes further into how to actually build visuals without burning a week resizing the same graphic for every channel.
What Is Visual Content Creation?
Visual content creation is the process of designing and producing visual content such as images, videos, infographics, and other graphic elements for marketing campaigns, social posts, websites, and other channels. It turns a message into something a viewer can understand in seconds rather than paragraphs.
An example of this process is turning one blog post into a carousel post for Instagram, a short explainer video, and a data visualization chart for a landing page. Each output uses the same core message but adapts the format to fit how that platform’s audience actually consumes content.
Why Does Visual Content Matter in Digital Marketing?
Visual content matters because the brain processes images 60000 times faster than text, and content with relevant images gets 94 percent more views than text only content. That speed advantage compounds across every channel, from social feeds to landing pages, where attention is scarce and decisions happen in seconds.
The numbers back this up consistently:
None of these numbers matter if the visuals themselves are unclear or off brand. Speed only helps when the message is worth understanding quickly.
What Are the Types of Visual Content?
The main types include static images, video, infographics, motion graphics, GIFs, memes, carousel posts, and interactive visuals. Each format does a different job.
Infographics deserve a specific mention. They get shared three times more than other content types and are 30 times more likely to be read than a plain text article covering the same information.
What Tools Do You Need for Visual Content Creation?
Design platforms like Canva, Adobe Creative Suite, and Figma cover most static and layout needs. Piktochart handles data visualizations well. Lumen5 and CapCut convert existing content into video. AI image generators like DALL-E and MidJourney now generate custom visuals directly from a text prompt.
Here is how the main tools break down by function:
Pick tools based on your team’s skill level and how often you actually produce each format, not on which tool looks most impressive in a demo.
How Do You Create Effective Visual Content?
Effective production starts with angle discovery, not format selection. Define your message first, then move through pre production, production, and post production stages, using content batching so one core idea becomes multiple assets instead of starting from a blank canvas every time.
Step 1: Angle discovery. Decide the specific message before choosing whether the output becomes video, a graphic, or an infographic.
Step 2: Pre production. Define the goal, audience, and visual hierarchy. Build a storyboard and shot list before any capture begins.
Step 3: Production. Use dual framing so one filming session serves both horizontal and vertical formats without reshooting the same scene twice.
Step 4: Post production. Apply version control and approval gates before final exports go to each channel.
Step 5: Cross format reuse. Adapt the finished asset across platforms through content batching instead of producing a separate version for every channel from scratch.
Skipping the first step is the most common mistake. Teams jump straight to design software before deciding what the visual actually needs to say.
How Is AI Changing Visual Content Creation?
AI image generators like DALL-E, MidJourney, and tools using Adobe Sensei now produce custom visuals from text prompts, cutting production time significantly. Jasper and AdCreative.ai apply similar generation to ad creative specifically. Ecommerce brands use the same underlying AI for virtual try-ons and 360-degree product views, and streaming platforms use it for personalized thumbnails tailored to individual viewer behavior, a form of hyper-personalization that would be impossible to produce manually at scale.
Commercial use carries real risk most teams overlook until a problem surfaces. Copyright ambiguity around the training data behind these models remains unresolved in many jurisdictions. Growing platform requirements to disclose AI generated content are also becoming standard, and skipping that disclosure can flag content for review or reduced reach.
Synthetic data and CGI are expanding what AI touches beyond marketing graphics into product renders and quality inspection imagery. Deepfake technology sits at the riskiest edge of this shift, and using any AI generated likeness of a real person requires explicit consent, not just a disclaimer buried in fine print.
Does Visual Content Affect Your Visibility in AI Overviews and AI Search?
Yes. AI search systems read the context around visual content, including alt text and surrounding copy, to decide what to cite. A well described data visualization or infographic with specific alt text is more likely to get referenced in an AI generated answer than an unlabeled decorative image.
This is a genuinely new consideration in 2026. Writing alt text used to be purely an accessibility checkbox. Now it doubles as a citation signal for systems like Google AI Overviews and ChatGPT search deciding which sources to reference when answering a question your visual could actually help answer.
How Do You Measure Visual Content Performance Beyond Vanity Metrics?
Separate vanity metrics from real business impact by tying each asset to a specific stage. Awareness assets should be judged by qualified reach. Consideration assets should connect to time on page or demo interest. Conversion assets should connect to form fills or sales, not just likes and views.
A product video on a landing page should not be judged only by play count. Ask whether visitors stayed longer, moved deeper into your site, or whether your sales team got fewer repetitive questions after the video launched. That is the difference between a number that looks good in a report and a number that actually explains why performance changed.
Larger teams are starting to use SHAP-based visualization to explain exactly which factors drove a shift in performance, turning a vague “engagement went up” into a clear breakdown of which specific visual element or audience segment caused the change.
What Accessibility Considerations Apply to Motion and Animated Content?
Beyond alt text on static images, motion graphics and animated content need their own accessibility check. Avoid rapid flashing that can trigger discomfort. Provide captions on any GIF or motion design carrying spoken or implied meaning. Give users a clear way to pause autoplaying animated content instead of forcing it to run continuously.
Stop motion and other slower frame rate animations are generally gentler on viewers than fast cut motion graphics, which is worth considering when the audience includes people sensitive to rapid visual movement.
Final Thoughts
Visual content creation works best as a system, not a series of one off requests. Start with the message before touching design software. Build workflows that let one strong idea become several assets instead of starting over for every channel. Write alt text like it matters for AI search, because now it does. Get those pieces right and the statistics about faster processing and higher engagement stop being trivia and start showing up in your own numbers.
FAQs
It is the process of designing and producing images, videos, infographics, and other visual assets for marketing campaigns, social media, and websites. It turns a written message into a format audiences can process in seconds rather than reading through full paragraphs of text.
A visual content creator is anyone who designs and produces visual content, from a solo social media manager using Canva to a specialized designer, videographer, or motion design artist working inside a larger team. The role can be one person or several specialists depending on team size.
One example is turning a webinar recording into a short video clip, a carousel post summarizing key points, and a data visualization chart highlighting one statistic. Each output reuses the same core content but adapts format and length to fit where it gets published.
A GIF is a short looping animation, often simple and reaction based. A motion graphic is more deliberate, using motion design to animate text, charts, or brand elements in a structured sequence. GIFs prioritize speed and humor. Motion graphics prioritize clarity and message delivery.
There is no universal number, but consistency matters more than frequency. Use content batching to produce several assets from one angle discovery session, then space them out on a content calendar rather than creating each post individually under time pressure right before it needs to publish.
Not always. Tools like Canva, Piktochart, and Crello include templates that let non designers produce professional looking static images and infographics. A dedicated designer becomes more valuable as volume grows or when motion graphics and complex data visualizations require specialized skill.
Canva offers the most capable free tier, covering social graphics, basic video, and simple carousel posts. For data visualizations specifically, Piktochart offers a limited free plan suitable for occasional infographic needs rather than high volume production.


