Brand Perception Metrics: What to Track and How to Measure Them

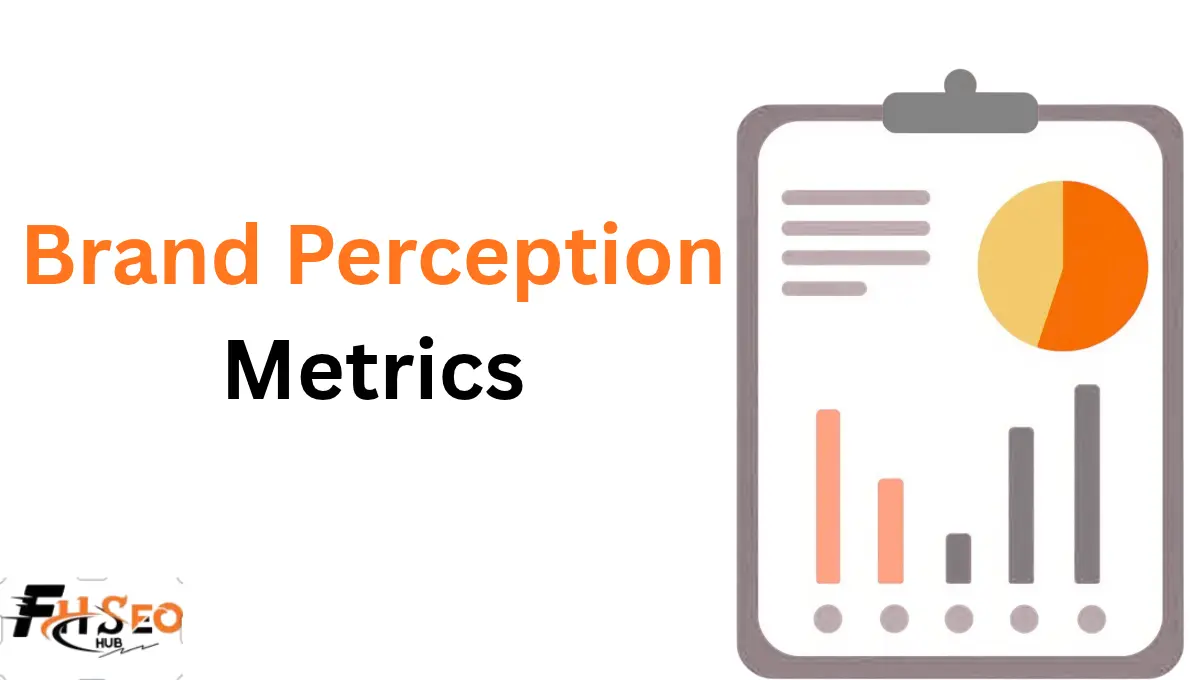
Brand perception metrics measure how people think and feel about your brand. The core set includes brand awareness, share of voice, sentiment, Net Promoter Score (NPS), customer satisfaction, purchase intent and brand loyalty. Track them through surveys, social listening and behavioral data, then compare against competitors over time to see whether perception is improving.
What Is Brand Perception?
Brand perception is the overall opinion people hold about a brand, based on their experiences, what they see and hear and what others say. It combines brand image, brand associations, perceived quality, perceived value and trust. Unlike brand identity, which a company controls, perception lives in the customer’s mind.
Perception has an emotional side and a rational side. Emotional brand perception covers feelings such as trust, excitement or frustration. Rational brand perception covers judgments about price, quality and reliability. Good measurement captures both, because a brand can score well on quality and still feel cold or untrustworthy.
Brand reputation is close but broader. Reputation includes how investors, employees, media and regulators see you, while perception usually focuses on customers and prospects.
Why Brand Perception Matters (A C-Suite Priority, Not Just a Marketing Metric)
Brand perception affects pricing power, customer acquisition cost, retention and how buyers choose between similar products. Strong perception lets a company charge more, win more deals and recover faster from mistakes. Weak perception raises acquisition costs and churn. That makes it a leadership metric as much as a marketing report.
Perception shows up in the numbers finance cares about. Brands with strong preference often need less discounting and lower customer acquisition cost (CAC), because buyers arrive already convinced. Customers who trust a brand tend to stay longer, which raises customer lifetime value and lowers churn rate.
It also shapes how buyers research. Prospects read reviews, Reddit threads and AI-generated summaries before contacting sales. If those sources describe your brand poorly, you lose deals you never knew existed. Brand perception metrics give leadership an early signal before revenue shows the damage.
Brand Metric Categories: Awareness, Perception, Loyalty, and Equity
Brand metrics fall into four groups. Awareness metrics show whether people know you. Perception metrics show what they think and feel. Loyalty metrics show whether customers stay and recommend you. Brand equity metrics show the commercial value created by the brand. Track at least one metric from each group for a complete picture.
| Category | Example metrics | What it tells you | Main data source |
| Awareness | Aided and unaided brand recall, share of voice, branded search | Whether people know your brand | Surveys, social listening, search data |
| Perception | Sentiment, brand associations, perceived quality, perceived value, trust | What people think and feel | Surveys, reviews, social listening |
| Loyalty | NPS, repurchase rate, churn rate, share of wallet | Whether customers stay and recommend | Surveys, CRM, sales data |
| Equity | Price premium, market share, brand preference | Commercial value of the brand | Sales data, pricing studies, surveys |
Rational and emotional measures run across all four groups. Brand behavior metrics, such as repeat purchases, show what customers do. Attitude metrics, such as preference, show what they say. Both matter, and the gap between them is often the most useful finding.
Top 10 Key Brand Perception Metrics to Track
The most useful brand perception metrics are brand awareness, share of voice, brand sentiment, NPS, CSAT, CES, brand associations, purchase intent, brand loyalty and market share. You do not need all of them. Pick five to eight that match your goals and track them consistently against competitors.
1. Brand Awareness (Aided and Unaided Recall)
Brand awareness measures how many people in your target market know your brand. Unaided brand recall asks people to name brands in a category without prompts. Aided recall shows a list and asks which they recognize. Unaided recall is the stronger signal because it reflects which brands come to mind first.
Track awareness by segment, not only overall. A brand may be well known among existing buyers but invisible to a new segment you want to win. Our guide to brand awareness for SEO covers how search supports this metric.
2. Share of Voice
Share of voice measures your portion of the conversation in your category compared with competitors. You can calculate it for social mentions, media coverage, paid ads or organic search visibility. A rising share of voice usually comes before rising awareness and market share, so it works as a leading indicator.
Compare like with like. Social share of voice and search share of voice can move in different directions, so report them separately. Brand mentions across the web feed both.
3. Brand Sentiment
Brand sentiment measures whether conversations about your brand are positive, negative or neutral. Social listening and social media monitoring tools apply sentiment analysis to posts, reviews and articles to gauge consumer sentiment. Emotion analysis goes further, tagging feelings such as anger, joy or trust. Sentiment shows how people feel, while volume shows how much they talk.
Automated sentiment analysis makes mistakes with sarcasm, slang and mixed opinions. Spot-check a sample of tagged mentions each month before reporting trends to leadership.
4. Net Promoter Score (NPS)
NPS asks customers how likely they are to recommend your brand on a 0 to 10 scale. Promoters score 9 or 10, passives 7 or 8 and detractors 0 to 6. NPS equals the percentage of promoters minus the percentage of detractors, giving a score from minus 100 to 100.
Fred Reichheld introduced NPS in a 2003 Harvard Business Review article. It is simple and easy to benchmark, which explains its popularity. The trade-off is depth. A score alone does not explain why customers feel as they do, so always add an open follow-up question.
5. Customer Satisfaction Score (CSAT)
CSAT measures how satisfied customers are with a specific product, service or interaction. It usually asks a single question on a 1 to 5 scale, often using a Likert scale. CSAT works best right after key moments, such as a purchase, support ticket or onboarding step.
CSAT is transactional. It shows how one experience felt, while NPS reflects the overall relationship. Use both together.
6. Customer Effort Score (CES)
CES measures how easy it was for a customer to complete a task, such as resolving an issue or making a purchase. It became popular after a 2010 Harvard Business Review article from the Corporate Executive Board argued that reducing effort builds loyalty more reliably than trying to delight customers.
High effort hurts perception quietly. Customers rarely complain about a clunky process, but they remember it when choosing whether to buy again.
7. Brand Associations and Perceived Quality
Brand associations are the words, ideas and feelings people link to your brand, such as “reliable,” “expensive” or “innovative.” Perceived quality and perceived value measure how good and how worthwhile people think your product is. Together they show whether your brand positioning matches what customers believe.
Measure associations with open questions (“What three words describe this brand?”) and rating scales on specific attributes. Compare the results with your intended positioning. Gaps between the two show where brand messaging consistency is breaking down and where your brand differentiation and competitive positioning need work.
8. Purchase Intent and Brand Consideration
Purchase intent measures how likely people are to buy from you in a given period. Brand consideration measures whether your brand makes the shortlist. These metrics connect perception to revenue. A brand can be well known and well liked but rarely considered, which signals a problem with price perception or relevance.
Track consideration and preference alongside competitors. If awareness rises but consideration stays flat, your messaging is reaching people without convincing them.
9. Brand Loyalty (Repurchase Rate, Churn and CLV)
Brand loyalty measures whether customers come back and stay. Behavioral signals include repurchase rate, churn rate, share of wallet and customer lifetime value (CLV). These metrics show what customers do, which is often more reliable than what they say in surveys.
Loyalty metrics come from your CRM and sales data, and they reflect how well your relationship marketing works. Pair them with survey data to understand why loyal customers stay and why others leave. Cohort analysis shows whether loyalty improves for newer customer groups.
10. Market Share
Market share measures your portion of total category sales. It is the most commercial brand metric and the slowest to move. Changes in perception usually show up in share of voice and consideration first, then in market share months later. Use it as the outcome metric that confirms whether perception gains turned into revenue.
How to Measure Brand Perception: Methods and Tools
Measure brand perception with a mix of methods. Brand perception surveys capture attitudes directly. Social listening tracks sentiment and share of voice in real time. Online review mining and voice of the customer programs add detail. Website analytics and sales data show behavior. Focus groups explain the reasons behind the numbers, so combine quantitative and qualitative methods.
| Method | Best for | Typical cost | Main limitation |
| Brand perception surveys | Awareness, associations, NPS, intent | Low for DIY tools; higher with paid panels | Survey fatigue, small niche samples |
| Brand tracking studies | Trends over time vs competitors | Often five figures a year through agencies | Cost and lag between waves |
| Social listening | Sentiment, share of voice, emotion analysis | Tools from about $199/month (Brand24) | Bots and sarcasm skew results |
| Online review mining | Perceived quality, pain points | Low to moderate | Reviews skew toward extremes |
| Focus groups | Deep reasons and language | High per participant | Small samples, not representative |
| Website analytics and CRM | Behavioral signals, loyalty | Usually existing tools | Shows what, not why |
Brand tracking costs vary widely. A 2026 UK pricing guide from Brandspeak puts a single agency-run consumer wave at roughly £10,000 to £25,000. It puts self-serve platforms such as Tracksuit from around £100 a month. Annual agency programs often run £30,000 to £60,000 or more, depending on markets and frequency.
A regular social media audit adds context to listening data. Survey design matters as much as tool choice. Use consistent questions across waves, a Likert scale for attribute ratings and enough responses per segment to compare groups. Brandspeak suggests 300 to 500 interviews per wave for a national consumer tracker and 1,000 or more for segment-level reporting.
Behavioral data fills the gaps. Branded search volume, direct traffic, returning visitors, click-through rate (CTR) on branded results and bounce rate on key pages all show how perception affects behavior. Website analytics also adds demographic insights to survey results.
AI search adds a newer layer. Buyers now ask ChatGPT and Google AI Overviews about brands, so how AI tools describe you shapes perception. Tools like Ahrefs Brand Radar track brand mentions, citations and sentiment in AI answers. Our guide to answer engine optimization covers how to influence those answers.
How Often Should You Measure Brand Perception?
Monitor real-time signals like sentiment and share of voice continuously or weekly. Run brand perception surveys quarterly in active, competitive markets and once or twice a year in stable ones. Measure CSAT and CES after key interactions. Match cadence to how fast your market and campaigns change.
| Metric type | Recommended cadence | Why |
| Sentiment, share of voice | Weekly or always-on | Catches crises and campaign effects early |
| CSAT, CES | After each key interaction | Ties scores to specific experiences |
| NPS | Quarterly or twice a year | Tracks relationship health without fatigue |
| Brand tracking surveys | Quarterly to annually | Shows awareness and perception trends |
| Market share, CLV | Quarterly | Confirms commercial impact |
Brandspeak notes that most organizations in active consumer markets track quarterly, while stable categories can manage annual tracking. Quarterly tracking costs roughly four times as much as annual tracking, so budget shapes cadence too.
Measure before and after major campaigns. A baseline wave before launch and a follow-up wave after gives cleaner evidence than comparing random quarters.
Building a Brand Perception Metrics Dashboard
A brand metrics dashboard brings awareness, perception, loyalty and equity metrics into one view with competitor benchmarks and trends. Keep it to five to eight core metrics, show each against targets and competitors and add a short note explaining changes. A dashboard nobody reads is worse than none.
Structure the dashboard in layers:
- Top line: three to four headline metrics, such as unaided recall, NPS, net sentiment and market share
- Trend view: each metric over the last four to eight periods
- Competitive benchmarking: your scores beside two or three main rivals
- Segment view: results by customer segment to reveal segment perception gaps
- Commentary: what changed, why and what the team will do
Set SMART targets for each metric: specific, measurable, achievable, relevant and time-bound. “Raise unaided recall among small agencies from 12% to 18% by Q4” is useful. “Improve brand awareness” is not.
Looker Studio works for simple dashboards that combine survey exports, Search Console and social data. Larger teams use built-in dashboards in Qualtrics, Brandwatch or their brand tracking platform. Pair the dashboard with your wider content KPIs so brand and performance metrics sit side by side.
Choosing the Right Brand Perception Measurement Tool
Choose tools based on the metrics you need, your budget and how often you measure. Social listening tools cover sentiment and share of voice. Survey platforms cover awareness, NPS and associations. Brand tracking platforms combine surveys with competitor benchmarks. Most mid-size brands need one listening tool and one survey tool.
| Tool | Type | Best for | Starting price |
| Brand24 | Social listening | Mentions, sentiment, share of voice for smaller teams | About $199/month |
| Sprout Social | Social management with listening | Teams that want listening inside publishing tools | From $79 per seat/month; listening costs extra |
| Brandwatch and Talkwalker | Enterprise listening | Large-scale sentiment and visual listening | Custom pricing |
| Meltwater | Media and social monitoring | PR teams tracking coverage and reputation | Custom pricing |
| YouGov BrandIndex | Syndicated brand tracking | Daily brand health benchmarks | Custom pricing |
| Qualtrics | Survey and experience platform | Enterprise surveys and NPS programs | Custom pricing |
| SurveyMonkey or Typeform | Survey tools | DIY brand perception surveys | Free and low-cost plans |
Prices change and often depend on mentions, seats or panel size, so confirm with each vendor. A common mistake is buying an enterprise listening tool before defining which metrics matter. Start with your questions, then pick the cheapest tool that answers them reliably.
DIY versus agency is the other choice. DIY tools cost less and move faster but need in-house research skills. Agencies add survey design, sampling and analysis, which matters when results will drive major spending decisions.
How to Improve Brand Perception
Improve brand perception by fixing the experiences that create negative views, then communicating the change consistently. Use your metrics to find the biggest gaps, such as low trust, poor perceived value or weak associations. Then act on product, service and messaging together. Messaging alone rarely fixes a real experience problem.
Start with the biggest gap between how you want to be seen and how you are seen. Customer perception data often shows the gap clearly. If customers rate quality highly but value poorly, the issue is price perception or proof of value, not product.
Practical steps that tend to work:
- Respond publicly and quickly to negative reviews and social posts
- Fix the top two or three pain points customers mention most
- Keep brand messaging consistent across ads, website, sales and support as part of holistic branding
- Publish case studies, testimonials and third-party reviews as social proof
- Earn coverage and mentions on trusted sites in your industry
Brand communication consistency matters because mixed messages weaken associations. For damage control after a crisis, our guide to reputation repair strategies covers recovery steps. In typical programs, perception metrics shift over several quarters, not weeks, so measure patiently.
Real-World Examples of Brands That Shifted Their Perception
Domino’s, Old Spice and Lego are well-documented examples of brands that changed how people saw them. Each started by facing an honest perception problem, then changed the product or message to match what customers wanted. Their stories show that perception shifts need real changes behind the marketing.
Domino’s launched its “Pizza Turnaround” campaign in late 2009. The company openly acknowledged harsh customer criticism of its pizza and introduced a new recipe. Admitting the problem publicly turned a weakness into a brand trust signal and improved brand favorability.
Old Spice repositioned itself in 2010 with “The Man Your Man Could Smell Like” campaign. A brand many saw as old-fashioned became associated with humor and a younger audience, which changed its brand associations sharply.
Lego refocused on its core building sets during its turnaround in the mid-2000s, after years of expansion into areas that diluted the brand. It also listened more closely to adult fans and builders. Clearer brand positioning helped rebuild perception with families and collectors.
The common thread is alignment. Each brand changed the experience and the message together, then held that position consistently.
Final Thoughts
Brand perception metrics only matter when they change decisions. Pick five to eight metrics across awareness, perception, loyalty and equity, measure them on a steady cadence and compare them with competitors. Then assign an owner to each gap. Start this quarter by running one baseline survey and setting up social listening for your brand and two rivals.
FAQs
No single metric covers everything. Many brands use NPS as a headline loyalty metric and pair it with sentiment, unaided recall and brand associations. Choose metrics that match your goals, such as awareness for new brands or loyalty for mature ones, and track them consistently.
Use free survey tools such as Google Forms, monitor reviews on Google and industry sites and track branded searches in Google Search Console. Read social comments and Reddit threads manually. These methods lack scale and benchmarks, but they reveal the main themes before you invest in paid tools.
Brand awareness measures whether people know your brand. Brand perception measures what they think and feel about it. A brand can have high awareness and poor perception, such as a well-known brand with a reputation problem. Track both, since awareness without positive perception rarely drives sales.
Include unaided and aided recall questions, three words people associate with the brand, attribute ratings on a Likert scale, NPS, purchase intent and preference versus competitors. Add one open question asking why respondents feel that way. Keep surveys short to reduce drop-off.
It varies, but perception usually shifts over several quarters rather than weeks. Social sentiment can respond quickly to a campaign or crisis. Awareness, associations and market share move more slowly, since they depend on repeated experiences and consistent messaging over time.
AI tools such as ChatGPT and Google AI Overviews summarize what the web says about your brand. If reviews, forums and articles describe you poorly, AI answers often repeat that view. Monitor how AI tools describe your brand and strengthen accurate, positive sources across the web.